
From gut feeling to numbers: how one equipment team put reports to work
Follow a mid-sized AV production company through five very ordinary problems — vanishing gear, surprise repair bills, double bookings, idle capital and a Monday-morning meeting nobody was prepared for — and see which report answers each one.
In this article
- Problem 1: Where does all our gear actually go?
- Problem 2: Maintenance feels expensive — is it?
- Problem 3: The same equipment keeps breaking — but which, and how badly?
- Problem 4: We plan bookings carefully — does reality care?
- Problem 5: How much capital is sitting on shelves doing nothing?
- The pattern
Most equipment teams don't have a reporting problem — they have five or six very concrete, very practical problems, and reporting is just the name of the tool that solves them. So instead of walking through report types one by one, let's walk through the problems.
The company below is a composite — call them Northlight Productions — a mid-sized AV and event production outfit with about 450 tracked assets: cameras, lights, sound gear, vans, rigging, and a storeroom of consumables. The situations, however, will be familiar to anyone who runs equipment for a living. All the reports mentioned live under Stats & Reports → Reports in Itefy, and the help center documents each one in detail.
Problem 1: Where does all our gear actually go?
Northlight's ops manager suspected that a handful of people accounted for most of the equipment traffic — and that a few checkouts never came back on time. Suspecting is not knowing.
The solution: the checkout activity report, grouped by user, then items, over the last month. It shows checkouts, items taken, overdue returns and average duration per person. The overdue column settled an old argument in one screen: two freelancers accounted for nearly all late returns. That turned a vague culture problem into a specific conversation — and a checkout-duration policy that people actually follow, because it's measured.
The follow-up habit: the same report is now saved with a weekly email schedule, so the Monday planning meeting starts with last week's numbers on the table instead of anecdotes.
Problem 2: Maintenance feels expensive — is it?
Every month, money leaked into repairs, services and transport — recorded diligently as events in Itefy, and then never looked at again. Finance asked the reasonable question: what does keeping the fleet running actually cost, and where does it go?
The solution: the costs report. It sums the expenses recorded on events, and the interesting move is grouping by classification first: routine maintenance vs. repairs vs. inspections vs. transport.
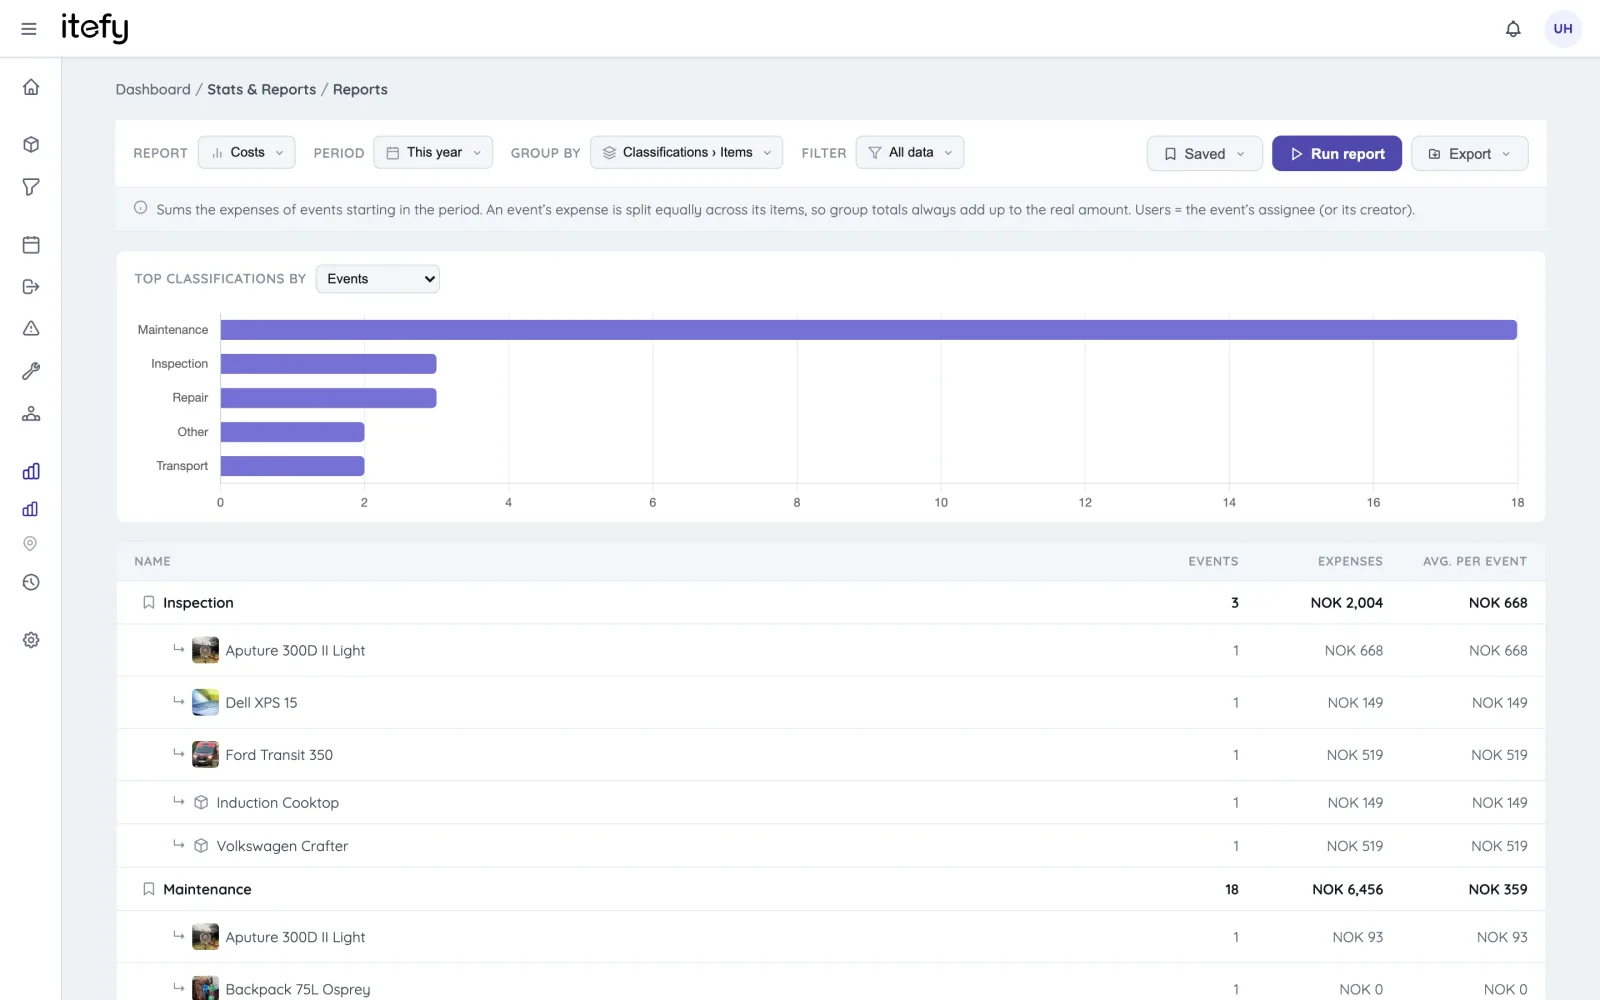
For Northlight the split was lopsided: repairs cost three times as much as planned maintenance — concentrated in two aging light fixtures that each cost more per year in repairs than their replacement price. Grouped by item, the report is effectively a repair-or-replace shortlist. The monthly version now goes to finance automatically, as a PDF, on the 1st.
Problem 3: The same equipment keeps breaking — but which, and how badly?
Cost is one lens on unreliable equipment; lost time is the other. A broken camera the day before a shoot costs far more than its repair bill.
The solution: the downtime report — the time each item spent marked Inoperative, the number of incidents, and the uptime share of the period. Grouped by type, it showed Northlight that their grip equipment ran at 99% uptime while the aging van fleet dipped below 93% — and one specific van accounted for most of it. Combined with the costs report from problem 2, that van's fate was sealed by two reports and ten minutes.
The team also turned on Compare with previous period here: downtime that's rising is a different problem than downtime that's high but falling after a maintenance push. The delta badges tell those two stories apart.
Problem 4: We plan bookings carefully — does reality care?
Northlight books gear against projects days in advance. But the schedule and the loading dock told different stories: crews grabbed extra bodies "just in case", picked gear up late, returned it later.
The solution: the planned vs. actual report, which compares reservations with what actually happened: how many bookings became real checkouts, how punctual pickups and returns were against the booked window, and whether the gear that was booked was the gear that was taken. An item match of 71% for one team meant nearly a third of what they carried out was never reserved — which is exactly why other teams kept finding their reserved kit missing. Making that number visible (and comparing teams) did more than any all-hands reminder ever had.
Problem 5: How much capital is sitting on shelves doing nothing?
Growth had been solved for years by buying more gear. The utilization report asked the awkward question: was the gear you already own actually busy?
The solution: the utilization report grouped by type, then items — in-use time as a share of the period, with never-used items reading as fully idle — next to the asset value report, which shows acquisition value, depreciation and current book value for the same groups. Idle percentage × book value = capital asleep on a shelf. Northlight found six-figure value in equipment below 10% utilization, some of which is now rented out between productions instead of gathering dust. The filter makes this precise: run it per location or per category, not as one fleet-wide average that hides the outliers.
The pattern
Notice what happened in every case: the data was already there — checkouts, events with expenses, condition changes, reservations. The reports just turned records into answers, and the two newest habits made the answers stick:
- Filter + group until the report matches the question ("repairs, vehicles only, by item, this quarter").
- Save it and schedule it so the question keeps getting answered without anyone remembering to ask — weekly to the ops meeting, monthly to finance.
If you're keeping equipment records anyway, you've already paid for these answers. The Reports feature page shows the full lineup — or start a free trial and ask your own data the first question.
Frequently Asked Questions
-
Start with the utilization report over the last full month, grouped by type and item. It immediately splits your fleet into equipment that earns its keep and equipment that sits idle — and almost every follow-up question starts from there.
-
Use the Filter dropdown on the Reports page to restrict any report to selected item types, locations, users or categories. Rows, subtotals and totals all respect the filter, and it carries into Excel, CSV and PDF exports.
-
Yes. Save a report and give it a weekly or monthly email schedule — the report is emailed as an Excel, CSV or PDF attachment to up to ten recipients, and recipients don't need an Itefy login.