
Reports 2.0: filters, charts, comparisons — and reports that email themselves
The Reports page just took its biggest leap yet. Filter any report down to the equipment you care about, see trends against the previous period, measure costs, downtime and inventory movement with three new report types — and have any report delivered to your inbox on a schedule.
In this article
- Filter any report
- See the trend, not just the number
- Three new report types
- Saved reports — and reports that email themselves
- Also worth knowing
- Try it on your own data
Reports have always been where your equipment history pays off. Today they get a lot more powerful. This release turns the Reports page from a place you visit into a system that answers your recurring questions — and, if you want, delivers those answers to your inbox without you lifting a finger.
Here's what's new.
Filter any report
Every report — all ten types — can now be restricted to exactly the slice of your operation you care about. Open the new Filter dropdown and tick the item types, locations, users or categories to include. The rows, the subtotals and the grand totals all reflect the filter, so "utilization for the AV gear at the Oslo warehouse" is now a ten-second job instead of a mental exercise.
Filters work together with grouping, they follow along into every export, and each report type offers the filter dimensions that make sense for it.
See the trend, not just the number
A number on its own rarely answers the question behind it. Was 62% utilization good? Compared to what?
Two additions fix that:
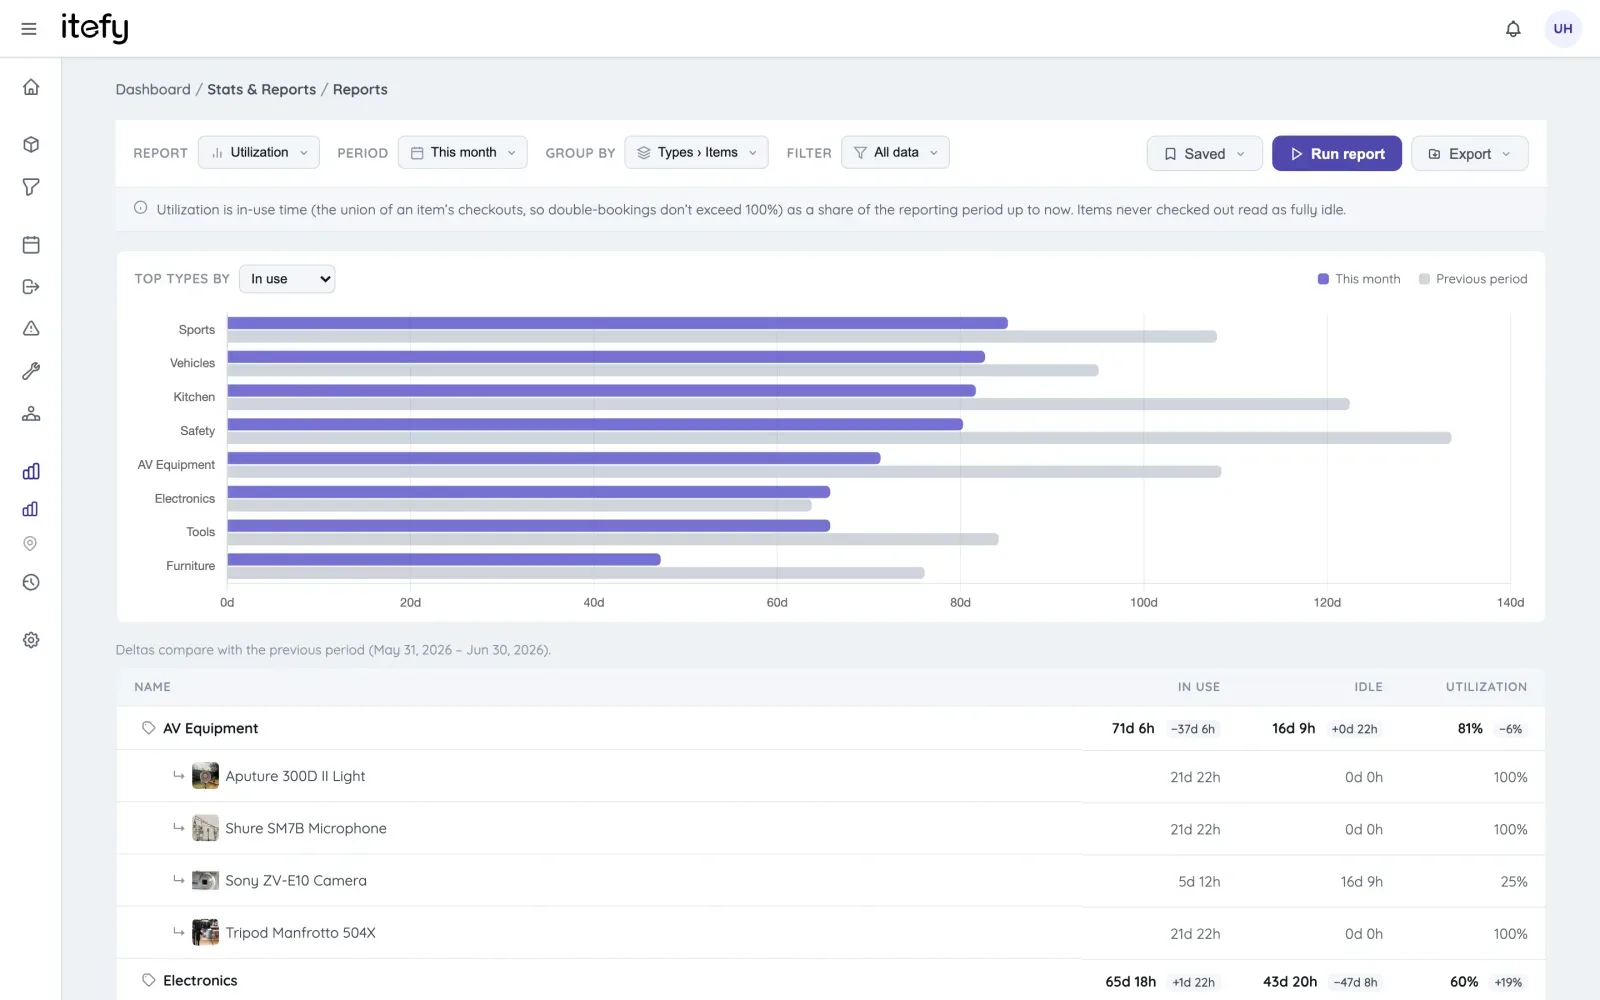
- Every report now opens with a chart of the top groups, by a measure you pick — the biggest cost drivers, the most-used equipment, the types with the most downtime.
- Compare with previous period, a new toggle in the Period dropdown, runs the same report for the window immediately before your selected one. Deltas appear next to the totals and the top-level rows, and the chart shows both periods side by side.
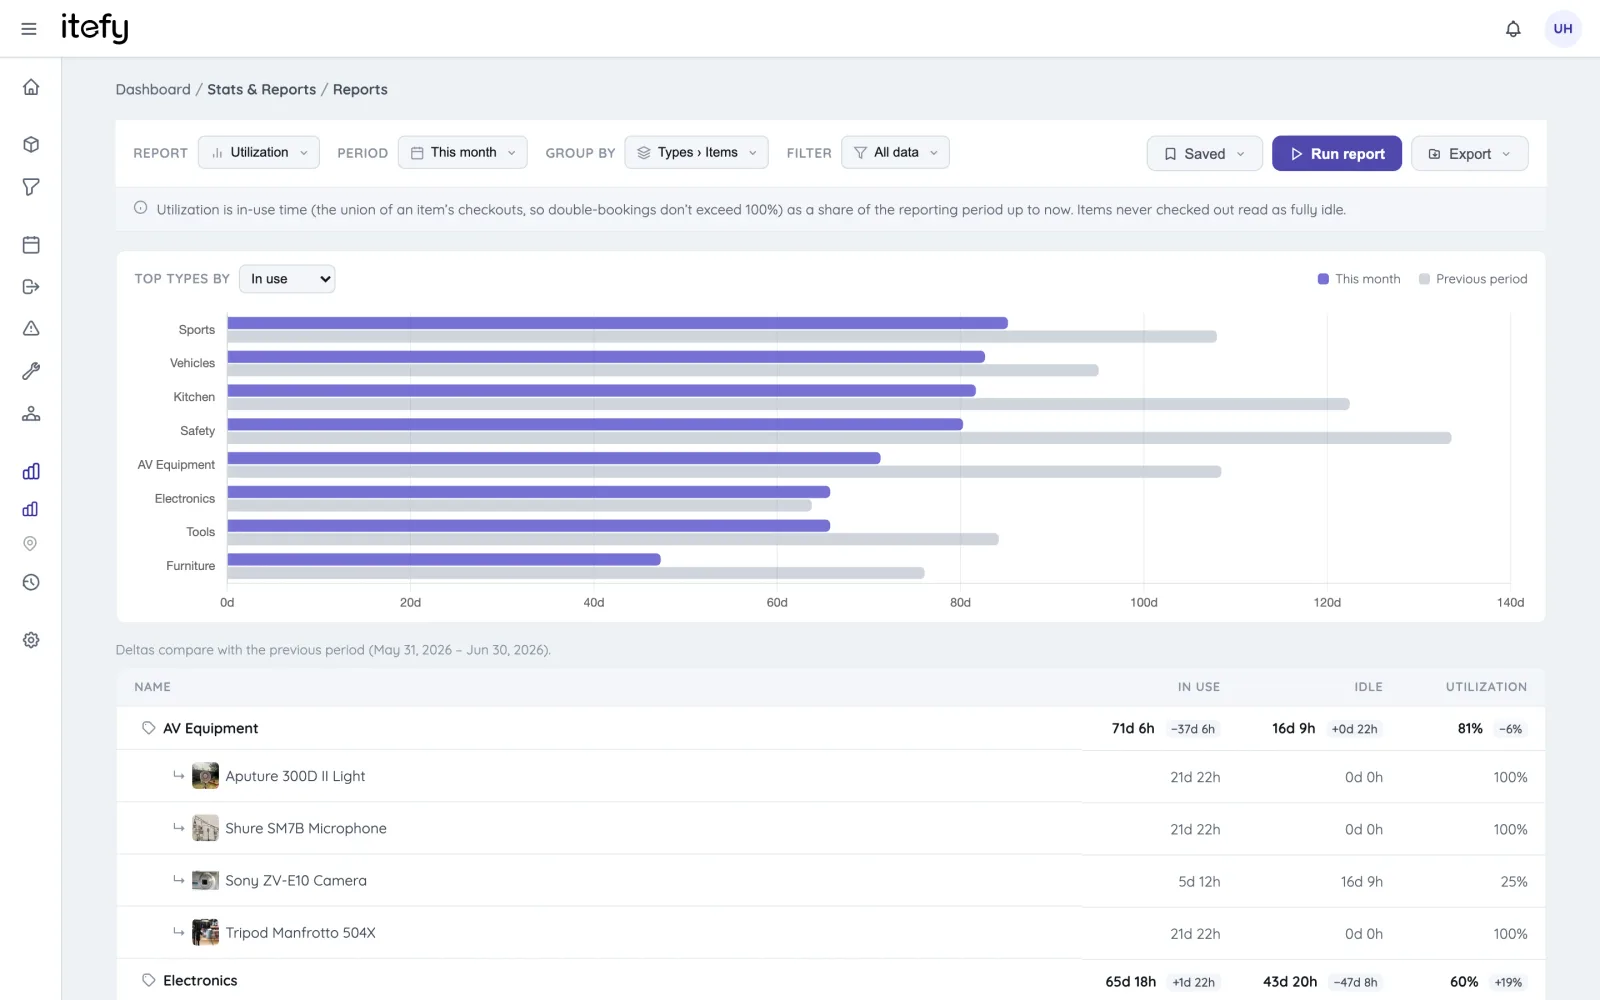
Up or down since last month is now one glance — for any report, any grouping, any filter.
Three new report types
The report engine gained three members, bringing the family to ten:
Costs
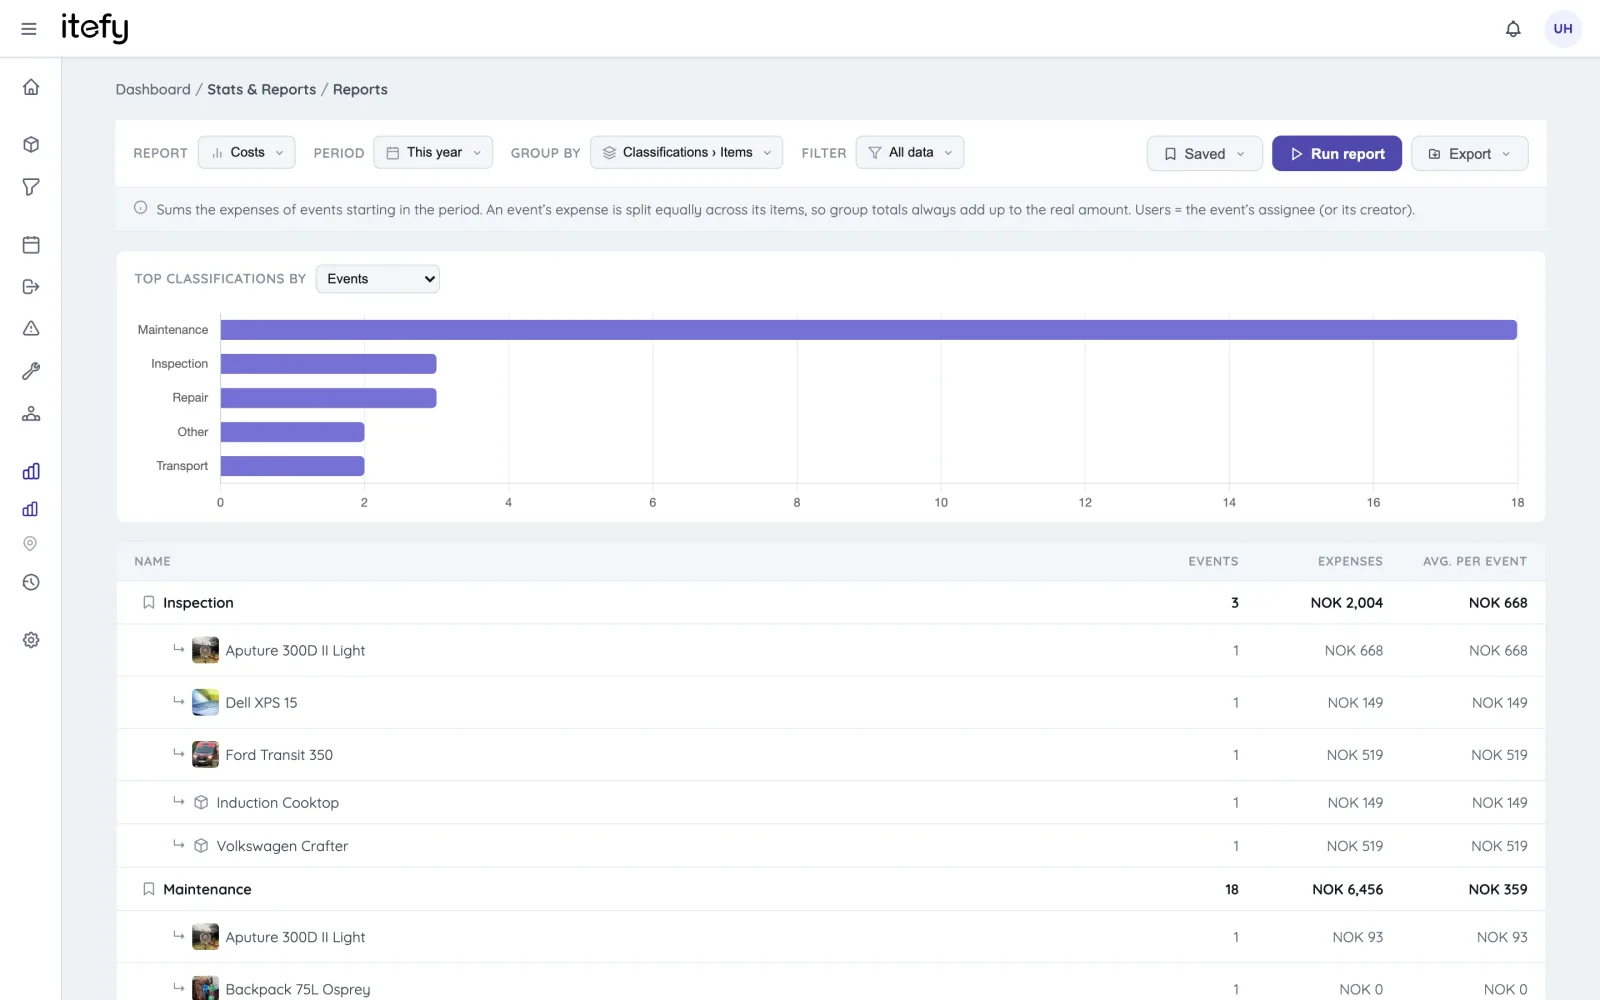
Sums the expenses recorded on your events — maintenance, repairs, inspections, transport — for any period. Group by classification to see what routine maintenance costs compared to repairs, or by item, type, location or the person responsible. An event's expense is split fairly across its items, so group totals always add up to the real amount.
Downtime
How long was each item out of service? The downtime report measures the time items spent in the Inoperative condition, counts the incidents, and shows the resulting uptime share of the period — the fastest way to find the equipment that keeps letting you down.
Inventory movement
For consumables and stock: how much was added, how much was withdrawn, and the net change — per item, type, location, or the person who recorded the movement.
Saved reports — and reports that email themselves
If you run the same report every week, you shouldn't have to rebuild it every week. The new Saved menu on the Reports page stores a complete report setup — type, grouping, filters, period, comparison — under a name. Applying it later restores everything and runs it, in one click.
And here's our favourite part: any saved report can be put on an email schedule.
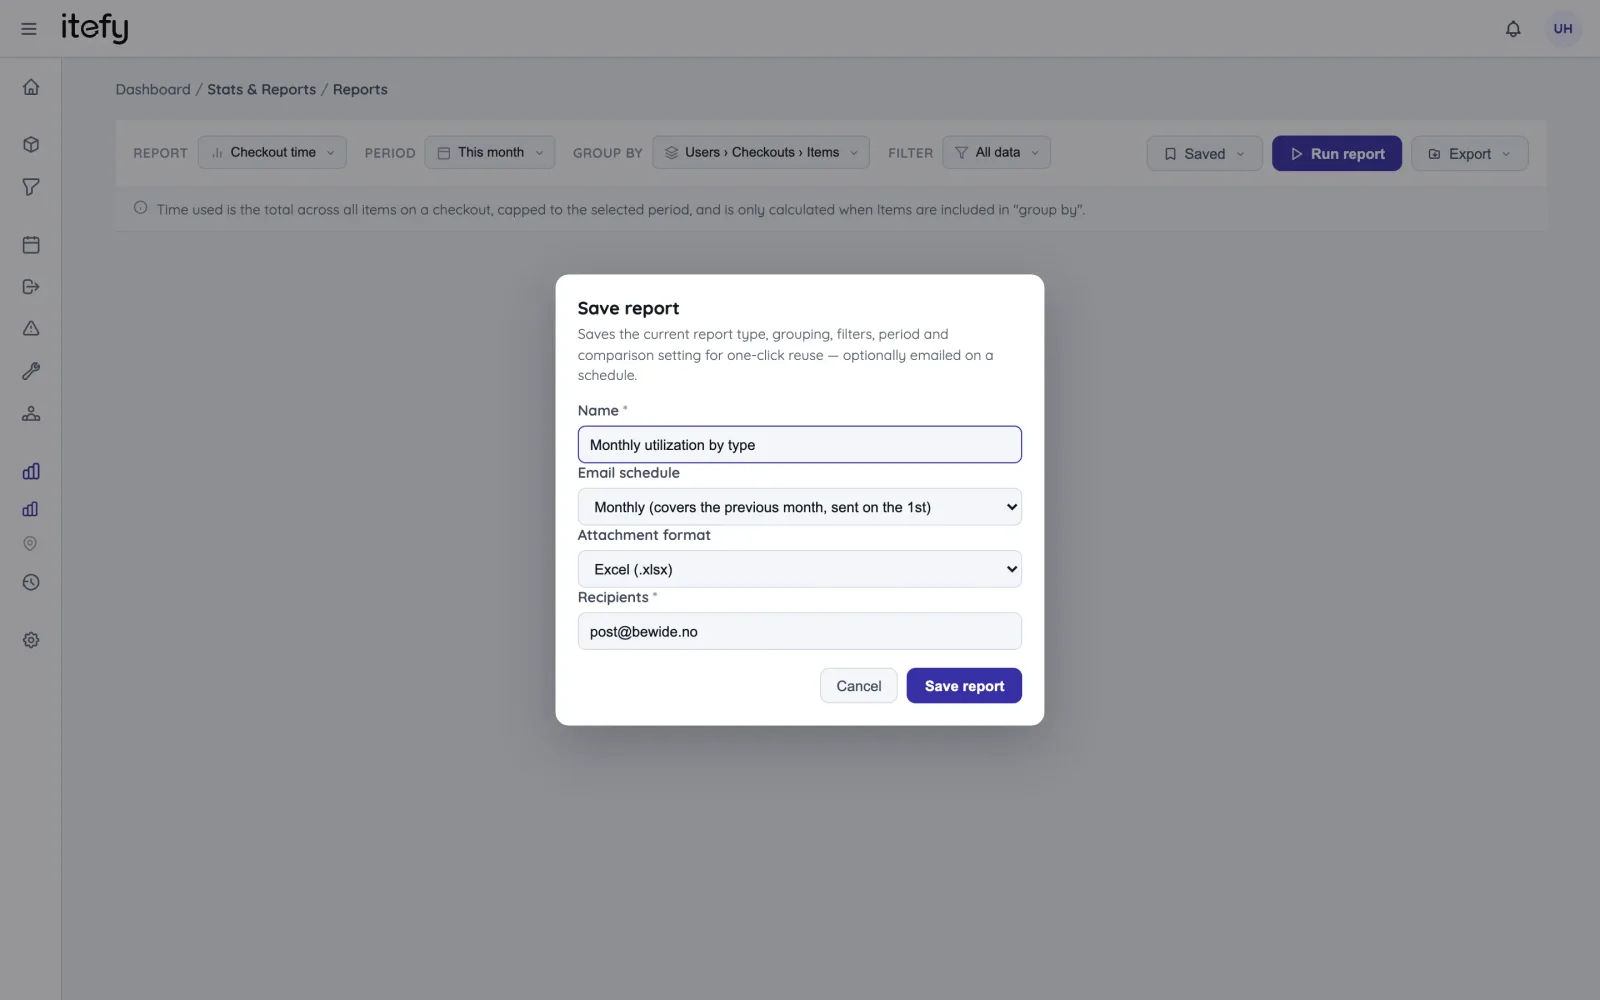
- Weekly reports are sent Monday morning and cover the previous week (Monday–Sunday).
- Monthly reports are sent on the 1st and cover the previous calendar month.
- Delivery is an email with the report attached as Excel, CSV or PDF — to up to ten recipients, who don't need an Itefy account.
The Monday-morning utilization summary for your operations manager, the monthly cost report for finance, the weekly overdue-checkout list for the team lead — set them up once, and they arrive on their own. Deleting the saved report stops the schedule.
Also worth knowing
- Reports and scheduled delivery are available on the Startup plan and higher.
- Everything described here works with the existing export formats — Excel, CSV and PDF.
- The Help Center article on reports covers all of it in detail, including exactly how each report type calculates its numbers.
Try it on your own data
Open Stats & Reports → Reports in your account and give the new filters and schedules a spin. If you're not using Itefy yet, start a free trial — the Reports page is at its best when it's your own equipment history it's answering questions about.