
Reports & insights that answer real questions
How much is the fleet worth? What sits idle? What did maintenance cost — and did usage match the plan? Your equipment history has the answers. Itefy surfaces them — on screen, or delivered to your inbox on a schedule.
Key features:
- Ten report types
- Filters, charts & period comparison
- Scheduled email reports
- Excel, CSV & PDF export
A report engine, not a canned PDF
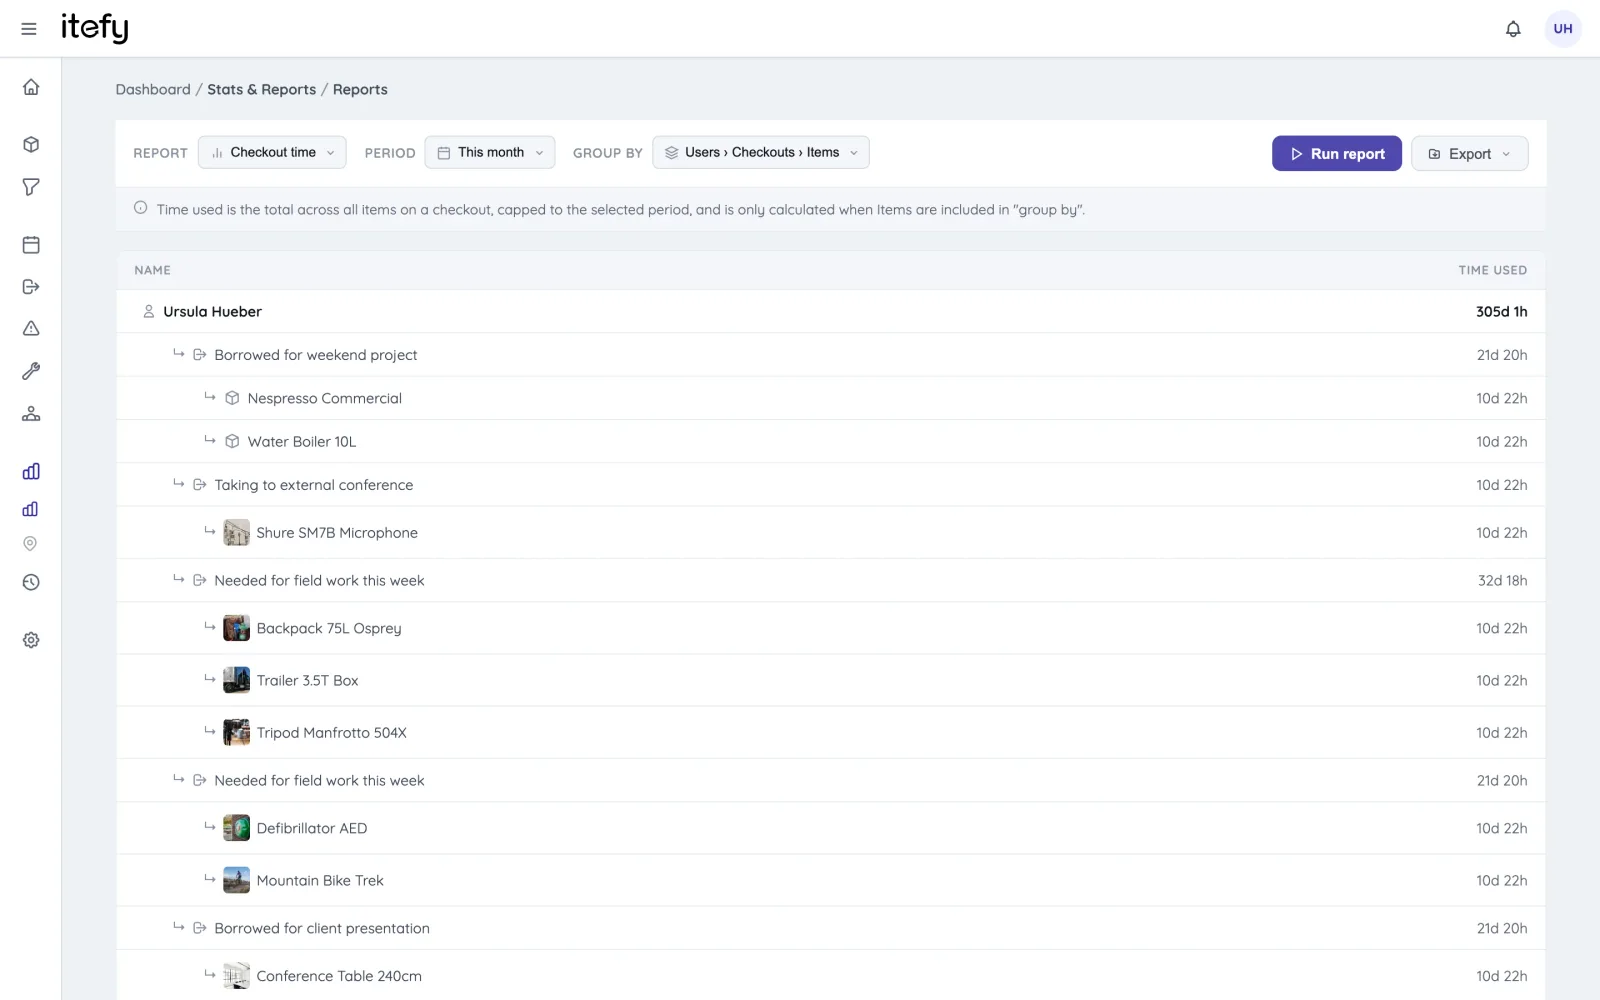
Pick a report type, a period, how to group the results — by item, person, type or location — and what to include, and read the answer on screen or take it with you. Checkout time, checkout activity, asset value, maintenance, costs, utilization, downtime, inventory movement, reservations, planned-vs-actual: each one answers a concrete question.
- Ten report types with flexible grouping and date ranges
- Filter any report to selected item types, locations, users or categories
- Drill from group totals down to the individual records
- One-click export to Excel, CSV or PDF
See the trend, not just the number
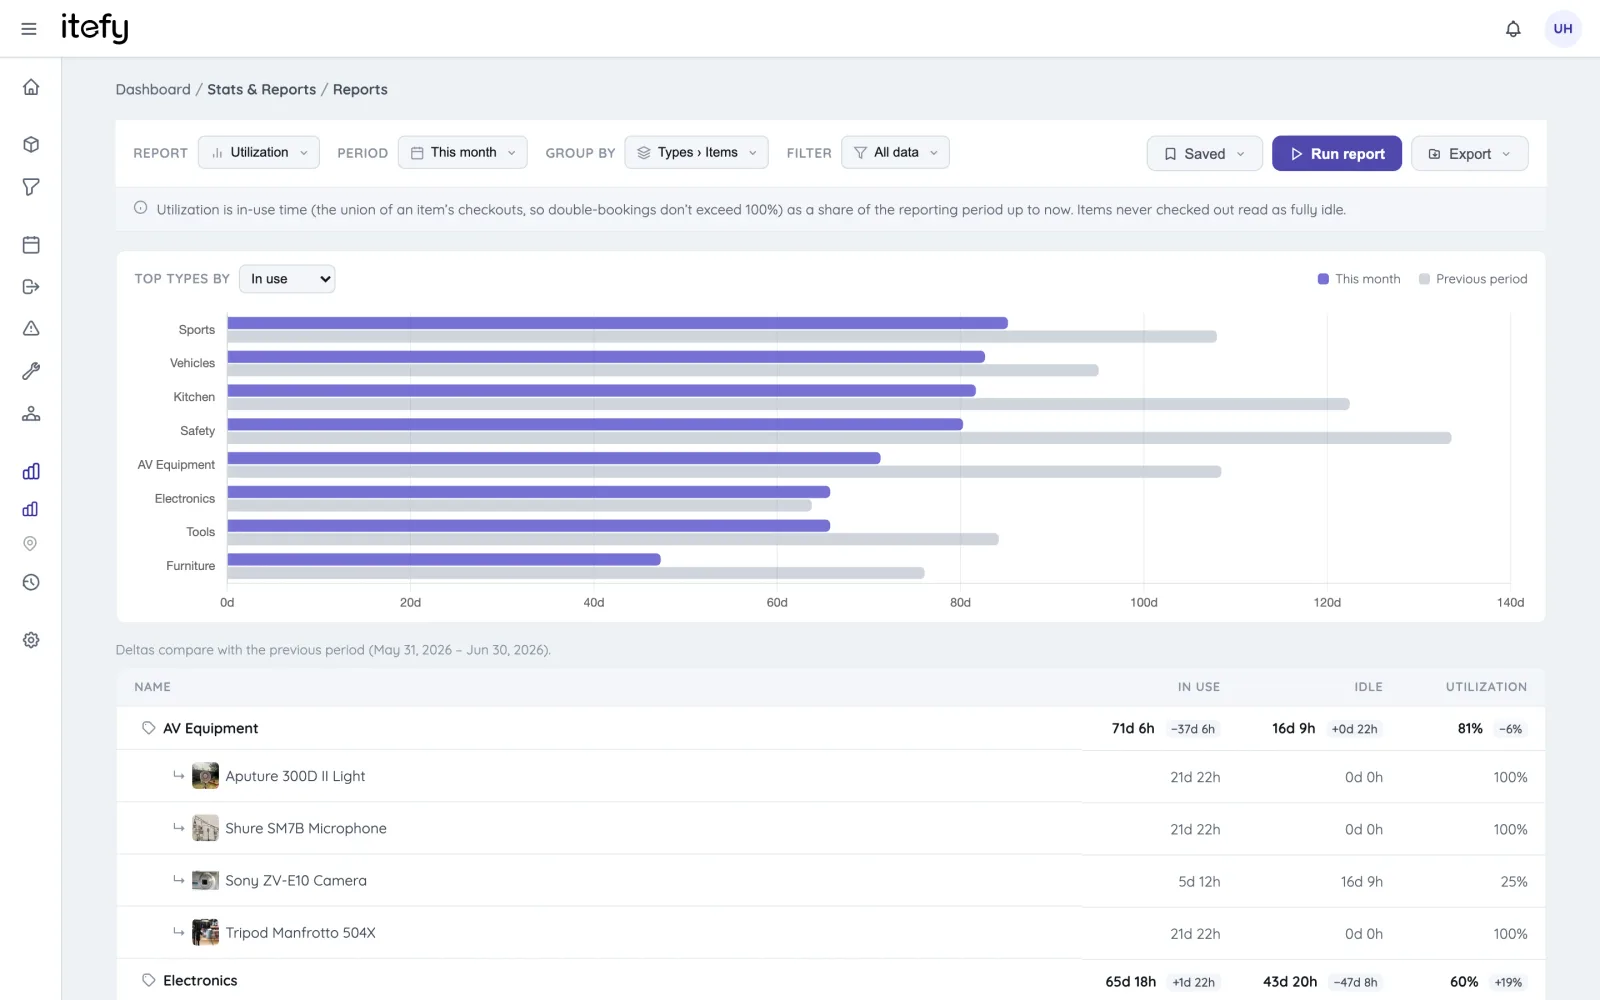
Every report opens with a chart of the top groups, by the measure you pick. Turn on period comparison and Itefy runs the same report for the window before — deltas appear next to every total, and the chart shows both periods side by side. Up or down since last month? Now it’s one glance.
- Chart of top groups on every report, measure selectable
- Compare with the previous period — deltas on rows, totals and chart
- Works with every report type, grouping and filter
Reports that deliver themselves
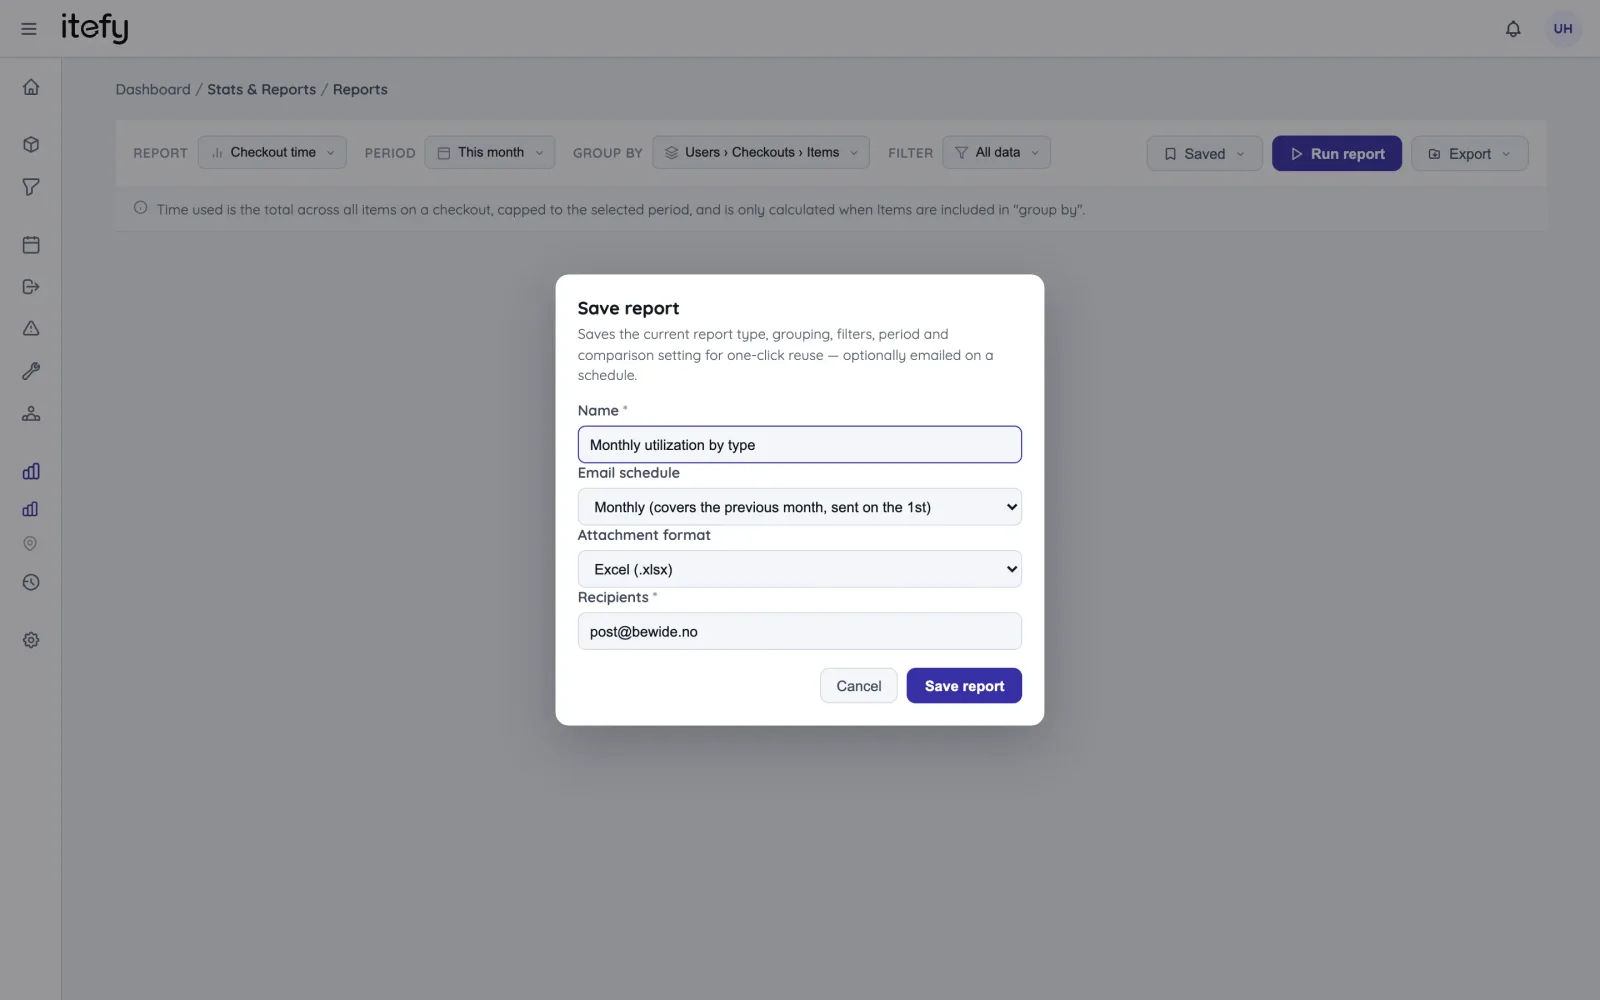
Save any report configuration — type, grouping, filters, period — under a name and re-run it in one click. Or put it on a schedule: every Monday morning covering the previous week, or on the 1st covering the previous month, emailed as an Excel, CSV or PDF attachment to whoever needs it. Recipients don’t need an Itefy account.
- Saved reports: your recurring questions, one click away
- Weekly or monthly email delivery with the report attached
- Send to managers, finance or customers — no login required
Know what your equipment really costs
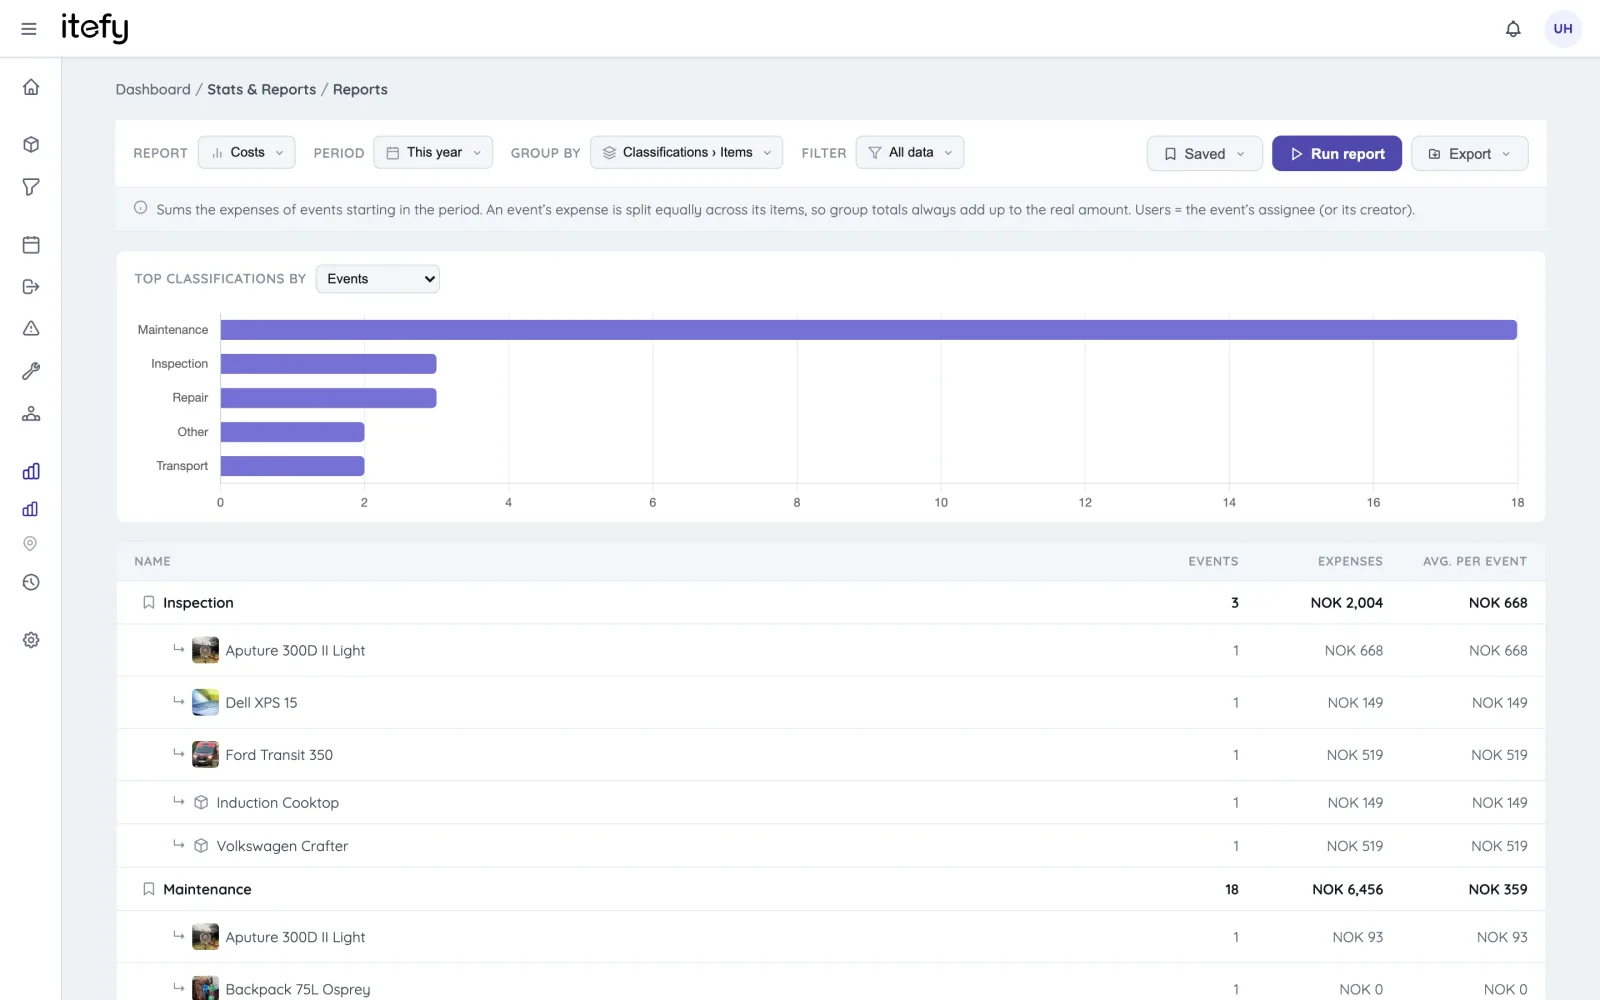
The costs report sums the expenses recorded on maintenance events, repairs, inspections and transport — grouped by classification, item, type, location or the person responsible. Pair it with the downtime report (time out of service, incidents, uptime share) and the inventory movement report to see the full operational picture.
- Costs by classification: maintenance vs. repairs vs. transport
- Downtime & uptime share per item or type — find the troublemakers
- Inventory movement: stock added, withdrawn and net change
Planned vs. actual — did reality match the plan?
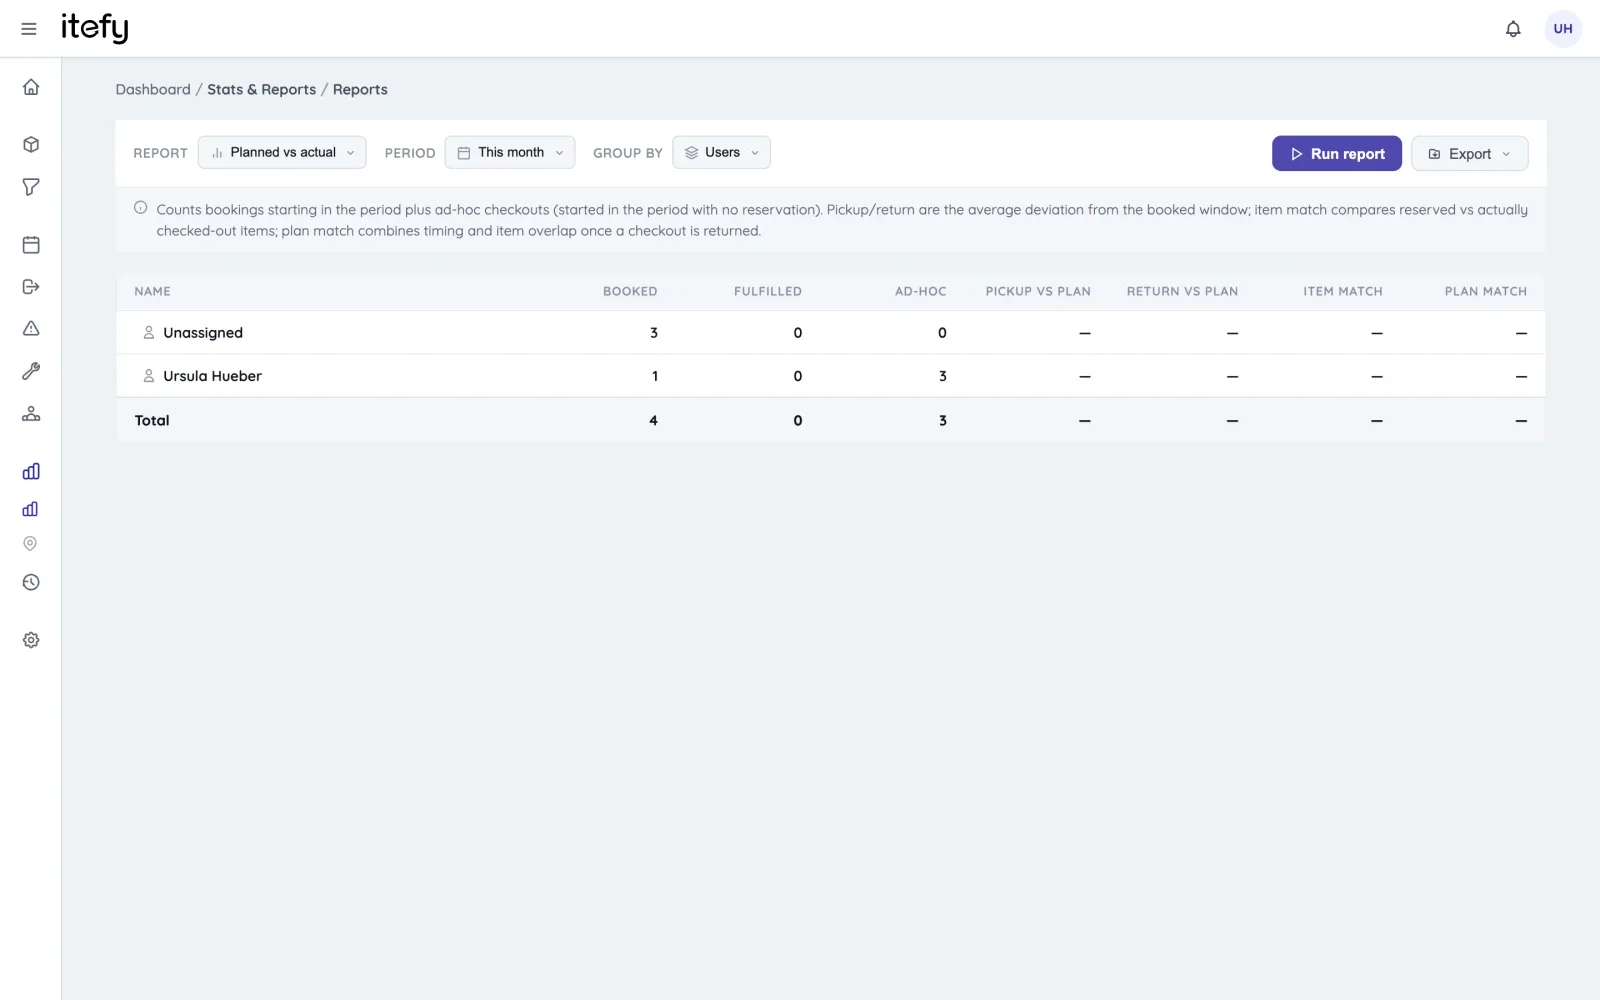
A report that compares your reservations with what actually happened. How many bookings were fulfilled? How punctual were pickups and returns? Was the equipment that was booked the equipment that was used? Now you know — per team, per period.
- Fulfilment rate: bookings converted to real checkouts
- Pickup and return punctuality against the booked window
- Item match: reserved gear vs. gear actually taken
Live status on the dashboard
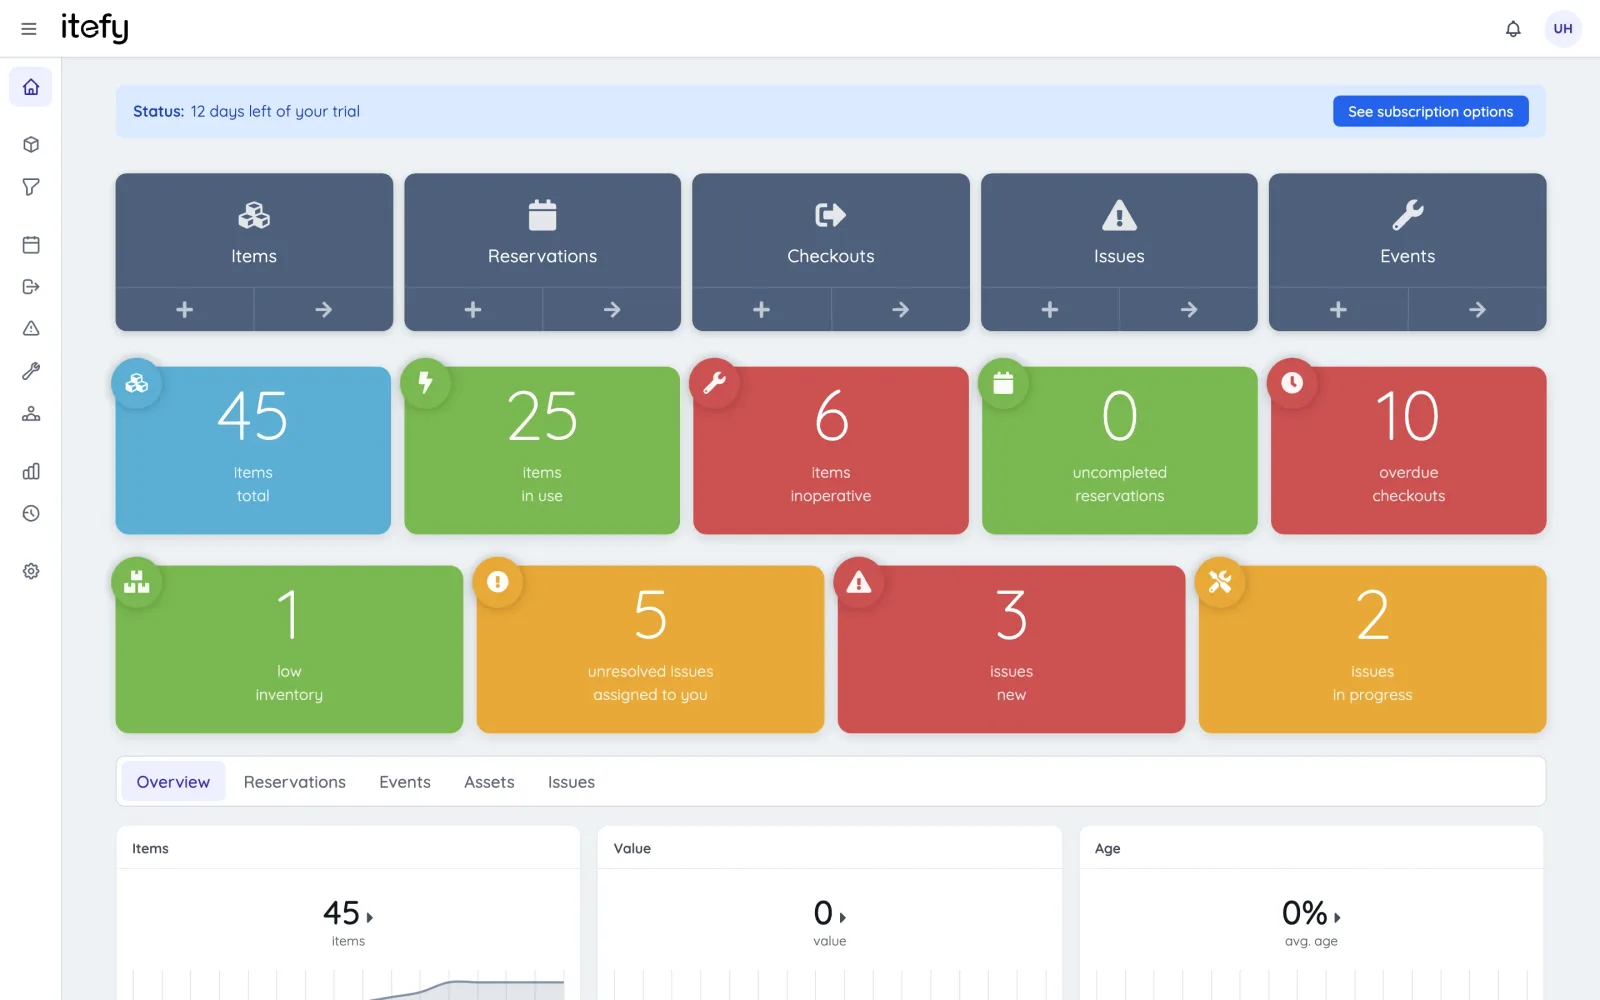
You shouldn’t need to run a report to know how things stand. The dashboard tracks the key numbers continuously — utilization, condition, overdue work, asset value, reservation fulfilment — with trends, and every number clicks through to the records behind it.
- KPI tiles with trends for utilization, condition and value
- Overdue checkouts, open issues and low stock — always visible
- Every number links to the filtered list behind it
Insights down to the single item
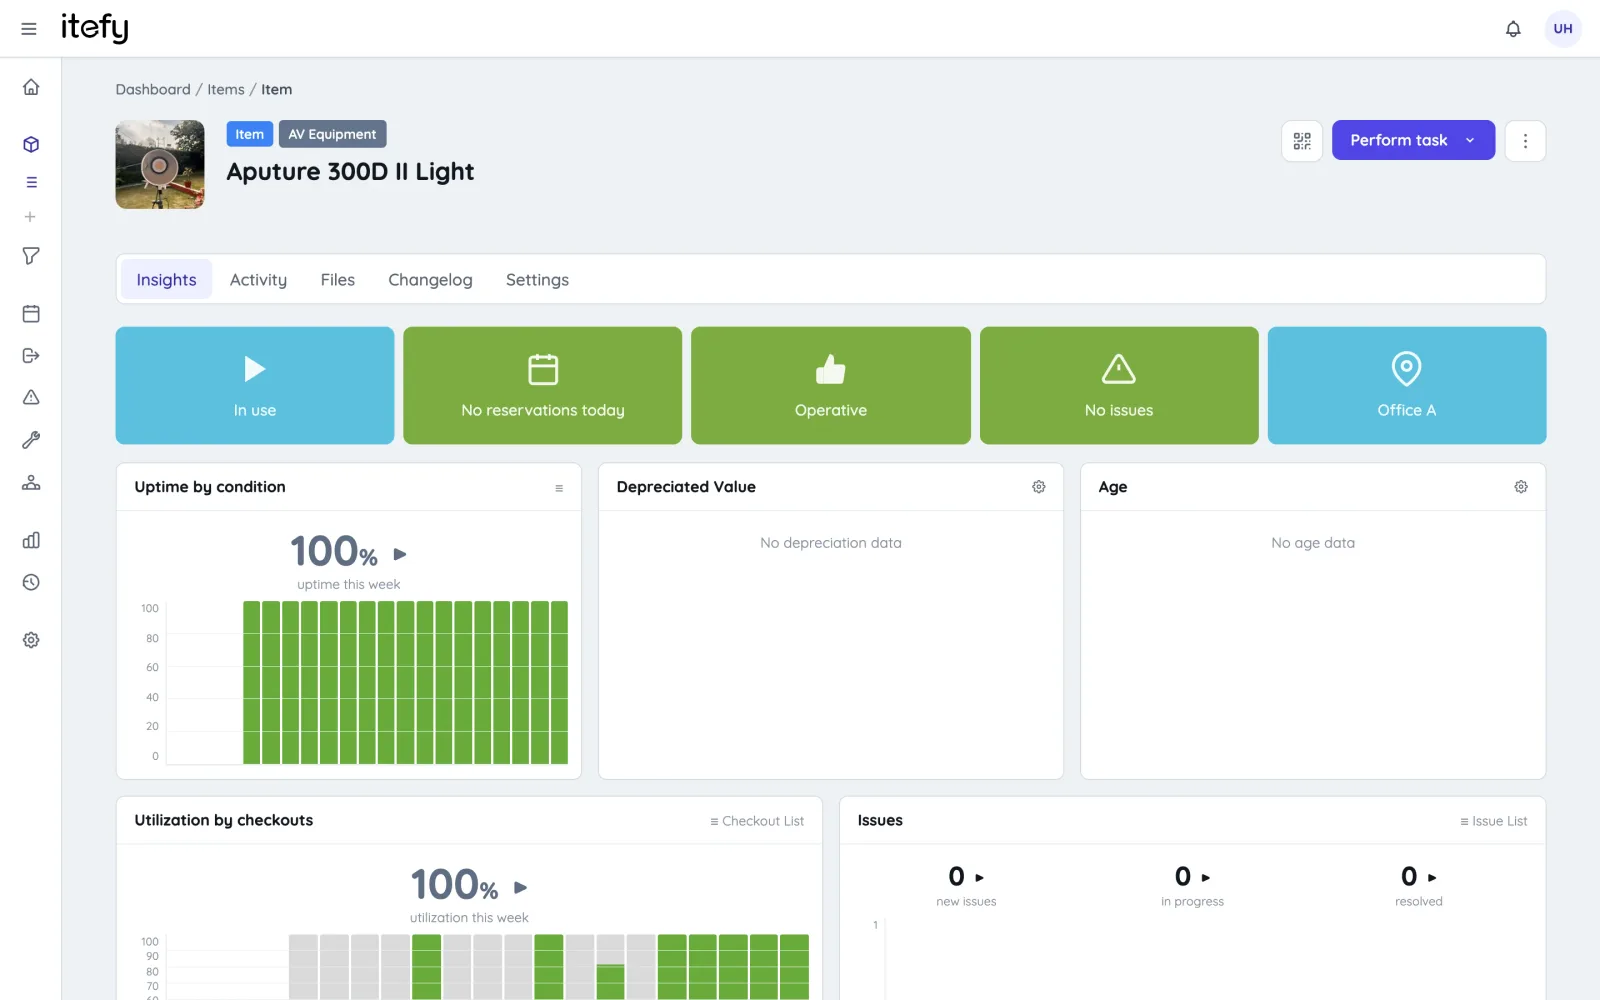
Every item page carries its own statistics — uptime by condition, utilization by checkouts, depreciated value, issue counts — plus account-wide change logs for condition, location and inventory, each searchable and exportable.
- Per-item uptime, utilization and value on the Insights tab
- Account-wide change logs for condition, location and inventory
- Location statistics: item counts and combined value per location
Reporting is the payoff — here’s what feeds it
Checkouts
Every handover recorded — the raw material for usage and utilization reports.
Checkout & check-inReservations
Plans on the calendar — the baseline that planned-vs-actual measures against.
SchedulingMaintenance
Events and issues with costs — the basis for maintenance reporting.
Maintenance managementDepreciation & value
Purchase data per item rolls up to asset value per location and in total.
Asset registryTake control of your equipment
Try every feature free for 14 days. No credit card, no obligations.