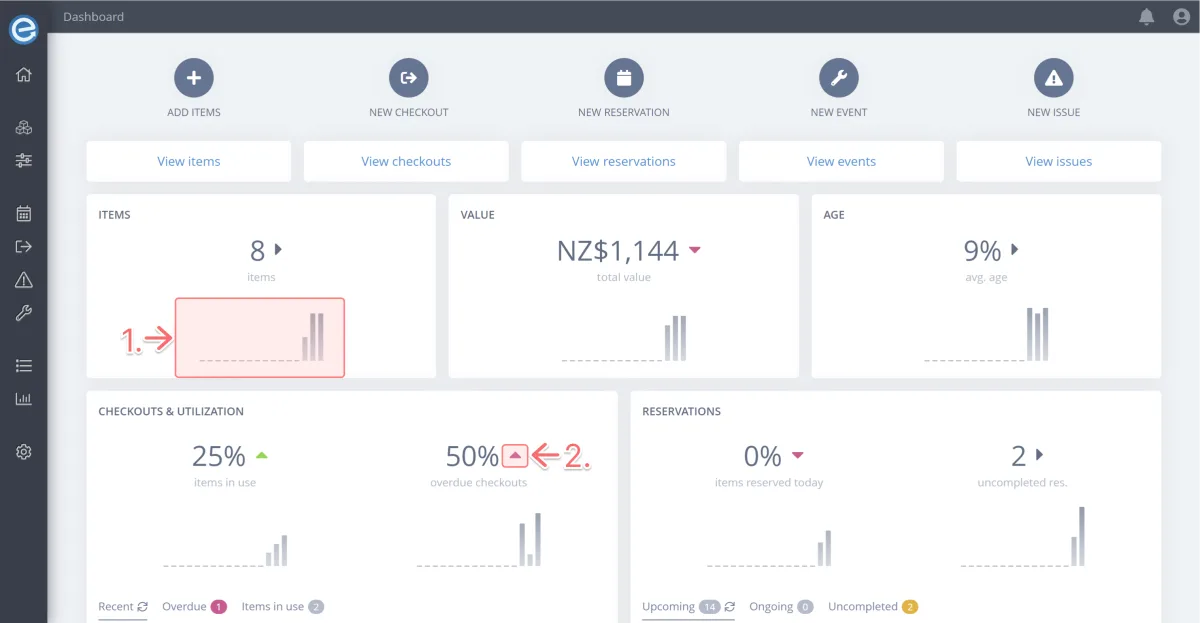
- The graphs on Itefy's dashboard indicate a trend over several weeks (one bar represents one week).
- The color-coded arrows help you quickly identify what needs attention:
Red = needs immediate attention
Orange = needs some attention
Green = no attention required